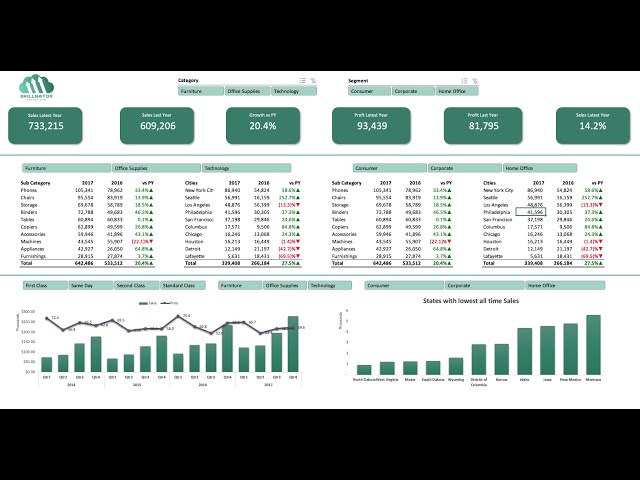
Dashboards tells a visual story about how a business is performing. They can help us make data-driven decisions. This video demonstrates how to create dashboards in Microsoft Excel. It covers the use of pivot tables, pivot charts, and slicers -- among other features.
Here is the sample file: https://www.codybaldwin.com/sample-file-executive-dashboards.
Interested in learning more. You can use the following link to enroll in my course, "Become a Microsoft Excel Wizard in 1 Hour": https://www.codybaldwin.com/excel-course.


40 Comments