Recommended videos
Recommended videos
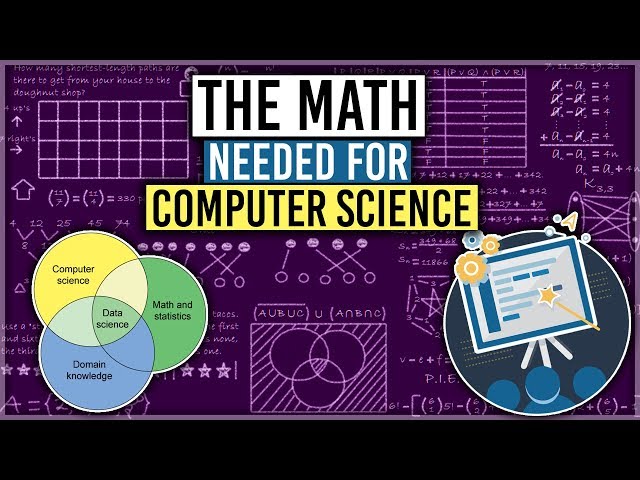
The Math Needed for Computer Science
2,279,378 views
Computational Representations
1,087 views


Qualitative and Quantitative Data
1,413 views
Measuring and Graphing Quantities
853 views

Bozeman Science
1.36M subscribers
Wed, 14 Feb 2024 00:00:00 GMT

Tags
0 Comments